
Update! The Mobile-First Holiday: eCommerce Stats You Need To Know
At this very moment, retail executives around the US are likely screaming about their Black Friday and Cyber Monday sales performance. For some, these sounds resemble a triumphant war chant, for others, these are the shrill cries of defeat. The reason? Mobile-first adoption.
No matter where you stand, this data changes the eCommerce landscape. Here are the latest stats and key trends from the long-weekend of holiday sales events. We will update this article as soon as new data is released, so make sure you subscribe to be the first to know!
Thanksgiving Takes an Extra Helping
On Thanksgiving day, as of 7:00am Pacific Time, U.S. consumers spent $406 million. By 2pm, Adobe announced that this number skyrocketed to a whopping $1.75 billion, representing a 23% increase over sales in the same time period in 2017. By the end of the day, Americans beat out last year’s sales for the day by a shocking 28%, resulting in a shocking 3.7 billion dollar Thanksgiving. Adobe initially projected a $3.1B bottom line for the holiday.
Mobile Wins Big
Here’s a quick breakdown of the major events in bite-size chunks:
Thanksgiving Day
Black Friday
$2.1 billion or 33.5% of sales came from smartphones this Black Friday. Another 10% of sales, or roughly $627 million, came from tablet users. All in all, the day yielded an impressive $6.2 billion, a 23.6% increase over 2018.
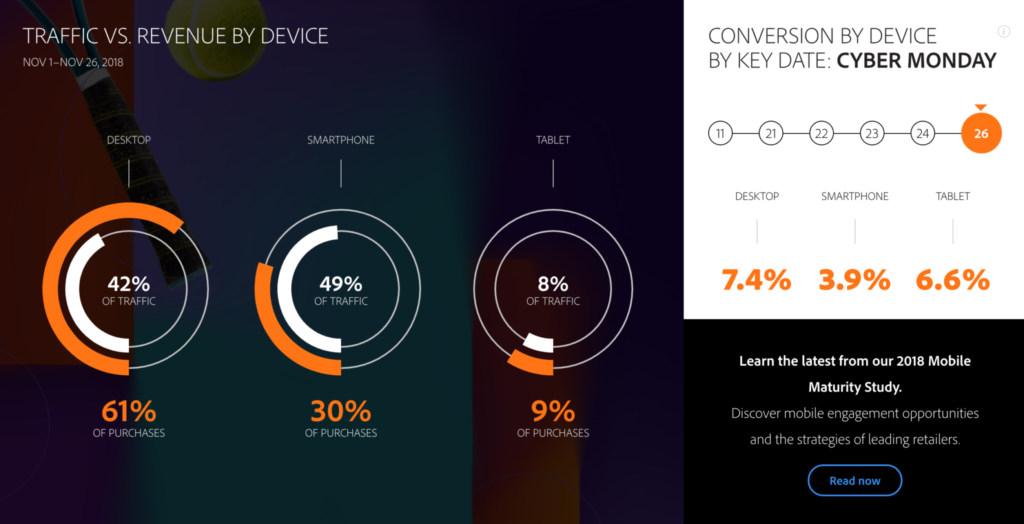
Cyber Monday Breaks The Internet
Here’s the big one. Cyber Monday sales shattered all previous records for online sales… in U.S. history.
Here’s the share of devices (as of ~1:30pm ET November 27, 2018):
 See more live stats at ExploreAdobe.com
7 Days of Spectacular Sales
Additionally, Adobe’s latest report notes that this November has seen 7 days where total sales broke the $2 billion mark (as of Nov. 28, 2018)… Thanks in no small part to the mobile sales spikes.
Omnichannel Adoption Drives Sales
The trend of “buy online, pick-up in-store (BOPIS)” continued, with the trend growing 50% during this past weekend over 2018. According to Adobe, this spells dollar signs for omnichannel merchants: “As the online and offline retail experience continues to blend, retailers with physical stores drove 28 percent higher conversions online.” While this trend helped retailers increase their share of online earnings, in-store sales lagged far behind.
It’s time to join the mobile-first movement. As Adam Morris, Redstage CEO notes, “Cusotmers are no longer expecting an in-store Black Friday and Cyber Monday, but instead, an omnichannel experience.” While many retailers successfully ramped up their omnichannel strategies for this holiday, the data shows this trend is here to stay, and more work is needed.
If you want to reduce mobile checkout friction before the holidays are over, contact us asap! To see the results we’ve achieved with our recently launched Magento Community Initiative, find the latest data here.
Final Thoughts
These extravagant stats spell success for an industry racing to close the mcommerce gap. It’s seems the industry is all-aboard the mobile-first customer experience wave. As Internet Retailing points out, retailers may have finally reached ‘always-on‘ mobile consumers. Now it looks like the key areas for improvement are streamlining mobile checkouts, and optimizing omnichannel experiences.
Update Nov. 28, 2018
Black Friday + Cyber Monday Stats You Need To Know
Here’s a breakdown of YOY holiday sales by device and region based on data collected by our partners at Nosto!
-
- United States
Desktop: 39% (2017) / 34% (2018)
Mobile: 56% (2017) / 61% (2018)
Tablet: 5% (2017) / 3% (2018)
- United States
-
- United Kingdom
Desktop: 47% (2017) / 40% (2018)
Mobile: 42% (2017) / 48% (2018)
Tablet: 11% (2017) / 12% (2018)
- United Kingdom
-
- Northern Europe
Desktop: 39% (2017) / 37% (2018)
Mobile: 51% (2017) / 57% (2018)
Tablet: 10% (2017) 6% (2018)
- Northern Europe
-
-
- France
Desktop: 69% (2017) / 67% (2018)
Mobile: 19% (2017) / 22% (2018)
Tablet: 12% (2017) / 11% (2018)
- France
- DACH
Desktop: 40% (2017) / 53% (2018)
Mobile: 42% (2017) / 39% (2018)
Tablet: 8% (2017) / 8% (2018)
-
Update Nov. 29, 2018
PayPal Mobile Payments Get A $2B Holiday Boost
-
- For the first time in PayPal history, mobile payment volume topped $1 billion, and did so on both Black Friday (November 23) and Cyber Monday (November 26). – PAYMNTS
-
- Adobe reports U.S. shopping carts averaged $138.00 during Cyber Monday, a 6% bump over last year.
-
- 49% of Black Friday traffic came from smartphones, driving 30% of online sales.
- “In the [PYMNTS] Checkout Conversion Index report, the 30 merchants with the fastest, most streamlined online checkouts ranked well. Conversely, the 30 merchants with the lowest scores offer a widely inconsistent checkout experience…”
Update Nov. 30, 2018
Our partners at BigCommerce identified a few additional trends in their Cyberweek 2018 Trends Report. Key findings include:
-
-
- While online stores continue to have the highest AOV for any sales channel, Facebook took second place, accounting for “70% of total GMV” for Fashion and Jewelry brands using the channel. Home and Garden brands selling on Facebook came in at 16% GMV.
- “The Fashion & Jewelry and Toys & Games verticals saw the highest GMV increases over 2017.
-
Recent Comments